
[EKS] EKS GPU 트러블슈팅: 3. 장애 재현 - 1. Device Plugin 비활성화
정영준님의 AWS EKS Workshop Study(AEWS) 5주차 학습 내용을 기반으로 합니다.
TL;DR
이전 글에서 구성한 GPU 환경(g5.xlarge × 2, gpu-operator v26.3.1, ClusterPolicy ready) 위에서 Device Plugin 비활성화 장애를 재현하고 디버깅한다.
- 장애 재현: ClusterPolicy
spec.devicePlugin.enabled: false패치 → 10초 내 device-plugin DaemonSet이 통째로 삭제되고, 노드 Allocatablenvidia.com/gpu가 0으로 떨어진다 - 증상: GPU Pod가
FailedScheduling: 0/4 nodes are available: 4 Insufficient nvidia.com/gpu로 Pending - 디버깅: Pod → Node → DaemonSet → ClusterPolicy → 노드 내부 순으로 좁혀가는 top-down 추적
- 운영 함정 3가지: 1.
status.state가ready유지 — status만 보면 놓친다, 2.kubectl debug node ... chroot nvidia-smi가 NVML 에러 — driver 사망으로 오해하기 쉽다, 3. Allocatable 키가 사라지지 않고 값만 0 —absent()기반 alert이 누락된다 - 복구:
enabled: true패치 → 40초 내 완전 복구. 동일 Pod의 Events에FailedScheduling → Scheduled전이가 보존된다
전제 환경
이전 글에서 구성한 환경을 그대로 이어받는다. GPU 노드 2대에 GPU Operator가 설치되어 ClusterPolicy가 ready 상태인 시점이다.
Baseline 스냅샷
장애 주입 전, 정상 상태의 스냅샷을 캡처한다. 복구 후 비교 기준이 된다.
노드 + GPU 라벨
# NFD 라벨 nvidia.com/gpu.present 로 GPU 노드 식별
kubectl get nodes -L nvidia.com/gpu.present,node.kubernetes.io/instance-type -o wide
NAME                                               STATUS   ROLES    AGE    INSTANCE-TYPE   GPU.PRESENT
ip-192-168-xx-xx.ap-northeast-2.compute.internal   Ready    <none>   5h3m   t3.medium
ip-192-168-yy-yy.ap-northeast-2.compute.internal   Ready    <none>   5h3m   t3.medium
ip-192-168-aa-aa.ap-northeast-2.compute.internal   Ready    <none>   31m    g5.xlarge       true
ip-192-168-bb-bb.ap-northeast-2.compute.internal   Ready    <none>   31m    g5.xlarge       true
시스템 노드 t3.medium 2대, GPU 노드 g5.xlarge 2대. GPU 노드에만 nvidia.com/gpu.present=true 라벨이 붙어 있다.
Allocatable GPU
# GPU 노드의 nvidia.com/gpu Allocatable 확인
kubectl describe node ip-192-168-aa-aa.ap-northeast-2.compute.internal | grep -A5 Allocatable
Allocatable:
  cpu:                3920m
  memory:             15147936Ki
  nvidia.com/gpu:     1
  pods:               50
두 GPU 노드 모두 nvidia.com/gpu: 1이 Capacity와 Allocatable에 정상 노출되어 있다.
Device Plugin DaemonSet
# gpu-operator 네임스페이스의 DaemonSet 전수 조사
kubectl get ds -n gpu-operator -o wide
nvidia-device-plugin-daemonset이 2/2/2 Ready, selector nvidia.com/gpu.deploy.device-plugin=true. 나머지 6개 DaemonSet도 정상이다.
ClusterPolicy
# Device Plugin 설정값 확인
kubectl get clusterpolicy cluster-policy -o jsonpath='{.spec.devicePlugin}' | jq .
{
    "enabled": true,
    "image": "k8s-device-plugin",
    "imagePullPolicy": "IfNotPresent",
    "repository": "nvcr.io/nvidia",
    "version": "v0.19.0"
}
enabled: true. 이 값을 false로 바꾸는 것이 이번 장애의 트리거다.
gpu-probe 테스트 Pod
장애 재현과 검증에 사용할 테스트 Pod 매니페스트다. nvidia.com/gpu: 1을 요청하고, GPU 노드 taint에 대한 toleration을 포함한다.
# gpu-probe.yaml — GPU 리소스 1개 요청 + taint toleration
apiVersion: v1
kind: Pod
metadata:
  name: gpu-probe
  labels:
    app: gpu-probe
spec:
  restartPolicy: Never
  tolerations:
    - key: nvidia.com/gpu
      operator: Exists
      effect: NoSchedule
  containers:
    - name: cuda
      image: nvcr.io/nvidia/cuda:12.4.1-base-ubuntu22.04
      command: ["sh", "-c", "nvidia-smi -L && nvidia-smi --query-gpu=name,driver_version,memory.total --format=csv"]
      resources:
        limits:
          nvidia.com/gpu: 1
Baseline 상태에서 이 Pod를 apply하면 7초 내 Scheduled → Running으로 전이한다. nvidia-smi 출력에서 NVIDIA A10G / Driver 580.126.09 / 23028 MiB이 확인된다. 장애 주입 후 같은 매니페스트를 다시 apply해서 결과를 비교할 것이다.
| 항목 | Baseline 값 |
|---|---|
| GPU 노드 | g5.xlarge × 2, nvidia.com/gpu.present=true |
Allocatable nvidia.com/gpu |
1 × 2 노드 |
| Device Plugin DS | 2/2/2 Ready |
ClusterPolicy spec.devicePlugin.enabled |
true |
ClusterPolicy status.state |
ready |
| gpu-probe Pod | 7초 내 Scheduled → Running |
장애 주입
ClusterPolicy 패치
Baseline Pod를 삭제한 뒤, ClusterPolicy의 spec.devicePlugin.enabled를 false로 패치한다.
GPU를 점유한 Pod가 있는 상태에서 device-plugin을 내리면 두 가지 문제가 생길 수 있다:
- 이미 실행 중인 컨테이너는 커널 레벨에서 GPU device file(
/dev/nvidia0)이 마운트된 상태라 계속 돌아간다. 이후 device-plugin이 복구되면 새 plugin 인스턴스가 kubelet에 재등록하는데, kubelet의kubelet_internal_checkpoint(device-container 할당 추적)와 새 plugin 상태가 어긋나 동일 GPU가 이중 할당되거나 “미할당”으로 잘못 인식될 수 있다. - 이 실습에서는 동일한 gpu-probe 매니페스트를 장애 상태에서 다시 apply해야 하므로, 기존 Pod가 남아있으면 이름 충돌이 생긴다.
이런 이유로 baseline Pod를 선삭제한다.
# Baseline Pod 정리
kubectl delete pod gpu-probe

# Device Plugin 비활성화 — 장애 트리거
kubectl patch clusterpolicy cluster-policy --type=merge \
  -p '{"spec":{"devicePlugin":{"enabled":false}}}'
clusterpolicy.nvidia.com/cluster-policy patched
kubectl edit대신patch를 쓴 이유: 1. 결정론적이고 재현 가능, 2. 스크립트에 그대로 복사 가능, 3. 인터랙티브 에디터 우회.
Operator reconcile 관찰
패치 직후 10초 간격으로 DaemonSet 상태와 노드 Allocatable을 polling한다. Operator가 ClusterPolicy의 desired 상태(enabled: false)에 맞춰 실제 클러스터 상태를 조정(reconcile)하는 과정을 시계열로 캡처하는 것이다.
# 10초 간격 × 9회 = 90초 polling
for i in $(seq 1 9); do
  sleep 10
  ds=$(kubectl get ds -n gpu-operator nvidia-device-plugin-daemonset --no-headers 2>&1 \
    | awk '{print $2"/"$3"/"$4}')
  alloc_1=$(kubectl get node ip-192-168-aa-aa.ap-northeast-2.compute.internal \
    -o jsonpath='{.status.allocatable.nvidia\.com/gpu}' 2>&1)
  alloc_2=$(kubectl get node ip-192-168-bb-bb.ap-northeast-2.compute.internal \
    -o jsonpath='{.status.allocatable.nvidia\.com/gpu}' 2>&1)
  echo "T+$((i*10))s DS=${ds} Alloc[node-1]='${alloc_1}' Alloc[node-2]='${alloc_2}'"
done
T+10s DS=from/server/(NotFound): Alloc[node-1]='0' Alloc[node-2]='0'
T+20s DS=from/server/(NotFound): Alloc[node-1]='0' Alloc[node-2]='0'
T+30s DS=from/server/(NotFound): Alloc[node-1]='0' Alloc[node-2]='0'
...
T+90s DS=from/server/(NotFound): Alloc[node-1]='0' Alloc[node-2]='0'
T+10초 시점에 이미 reconcile 완료. DaemonSet은 서버에서 NotFound(통째로 삭제됨)이고, 양쪽 노드 Allocatable은 0이다. Operator가 desired 상태(enabled: false)에 맞춰 device-plugin DS를 삭제하고, 노드의 GPU 광고가 사라지기까지 10초도 안 걸린 것이다.
예상 vs 실측
Device Plugin을 끄면 어떤 일이 벌어질지 직관적으로 떠올리기 쉬운 동작(“예상”)과, 실제로 polling과 이후 디버깅 과정에서 확인한 결과(“실측”)를 비교한다. 차이가 나는 부분이 운영에서 놓치기 쉬운 함정이다.
| 관찰 항목 | 예상 | 실측 | 함의 |
|---|---|---|---|
Allocatable nvidia.com/gpu |
키 자체 사라짐(absent) | 키 잔존 + 값 0 | absent() 기반 alert 누락 위험. == 0 조건이 정확 |
| Device Plugin DS | desired/current 0/0 (스케일 다운) | DS object 통째 삭제(NotFound) | Operator가 scaling이 아닌 destruction으로 동작. 복구 시 AGE 0부터 시작 |
| GPU Pod | Pending, Insufficient | Pending, 0/4 nodes: 4 Insufficient nvidia.com/gpu |
시스템 노드도 “Insufficient”로 표시 — scheduler 표현 방식 |
CP status.state |
— | ready 유지 |
함정: 의도적 disable도 정상 reconcile로 처리됨. status만 보고 안심하면 못 잡음 |
| Reconcile 시간 | 수십 초 | 10초 이내 | Operator reconcile 매우 빠름 |
디버깅 경로
장애 원인을 모르는 상태에서 GPU Pod Pending을 만났다고 가정하고, Pod → Node → DaemonSet → ClusterPolicy → 노드 내부 순으로 좁혀가는 top-down 추적을 따라간다.
1. Pod 레벨: “왜 Pending인가?”
# 장애 상태에서 gpu-probe 재배포
kubectl apply -f gpu-probe.yaml
sleep 30

# Pending 확인
kubectl get pod gpu-probe -o wide
NAME        READY   STATUS    RESTARTS   AGE   IP       NODE     NOMINATED NODE
gpu-probe   0/1     Pending   0          30s   <none>   <none>   <none>
# Events에서 FailedScheduling 메시지 확인
kubectl describe pod gpu-probe | tail -10
Events:
  Type     Reason            Age   From               Message
  ----     ------            ----  ----               -------
  Warning  FailedScheduling  30s   default-scheduler  0/4 nodes are available: 4 Insufficient nvidia.com/gpu.
                                                      preemption: 0/4 nodes are available:
                                                      4 Preemption is not helpful for scheduling.
Insufficient nvidia.com/gpu. 4개 노드(시스템 2 + GPU 2) 모두에서 GPU 리소스가 부족하다. 시스템 노드는 원래 GPU가 없고, GPU 노드도 GPU를 광고하지 않고 있다는 뜻이다.
다음 분기: “노드 자체는 있는데 GPU가 부족” → 노드 측에서 GPU 광고 상태를 확인한다.
참고: Pod Pending은 GPU 문제가 아닐 수도 있다
이번 실습에서는
Insufficient nvidia.com/gpu경로만 따라가지만, 실제 Pod Pending의 원인이 반드시 GPU와 관련된 것은 아니다.kubectl describe pod의 Events 메시지로 1차 분기를 결정한다.
분기 Events 메시지 1차 액션 Insufficient resource Insufficient cpu/memory/nvidia.com/gpu노드 Allocatable vs Pod requests 비교 Taint mismatch had untolerated taint {…}Pod tolerations 추가 Selector mismatch didn't match Pod's node affinity/selectornodeSelector / NFD 라벨 점검 PVC unbound pod has unbound immediate PersistentVolumeClaimsStorageClass / PV 상태 Topology spread didn't match topology spread constraintsspread rule 또는 노드 추가 Image pull 실패 ImagePullBackOff(Pending이 아닌 경우가 많음)이미지/credential 점검
2. Node 레벨: “GPU 노드가 GPU를 광고 중인가?”
Insufficient nvidia.com/gpu는 두 가지 원인이 가능하다. 1. GPU Allocatable 자체가 0이거나, 2. Allocatable은 있지만 다른 워크로드가 이미 전부 점유 중이거나. 노드별 Allocatable/Capacity를 일괄 비교해서 어느 쪽인지 판별한다.
# 전체 노드의 GPU Allocatable을 일괄 비교
kubectl get nodes -o json | jq -r '
  .items[] | {
    name: .metadata.name,
    instance: .metadata.labels["node.kubernetes.io/instance-type"],
    gpu_alloc: .status.allocatable["nvidia.com/gpu"],
    gpu_cap: .status.capacity["nvidia.com/gpu"]
  }'
{
  "name": "ip-192-168-xx-xx.ap-northeast-2.compute.internal",
  "instance": "t3.medium",
  "gpu_alloc": null,
  "gpu_cap": null
}
{
  "name": "ip-192-168-aa-aa.ap-northeast-2.compute.internal",
  "instance": "g5.xlarge",
  "gpu_alloc": "0",
  "gpu_cap": "0"
}
{
  "name": "ip-192-168-bb-bb.ap-northeast-2.compute.internal",
  "instance": "g5.xlarge",
  "gpu_alloc": "0",
  "gpu_cap": "0"
}
{
  "name": "ip-192-168-yy-yy.ap-northeast-2.compute.internal",
  "instance": "t3.medium",
  "gpu_alloc": null,
  "gpu_cap": null
}
g5.xlarge 두 노드 모두 nvidia.com/gpu: 0(키는 잔존, 값만 0). 시스템 t3.medium 노드는 키 자체가 null(정상). GPU 노드의 Device Plugin 광고가 끊긴 패턴이다.
다음 분기: “광고가 끊겼다” → 광고의 주체인 Device Plugin DaemonSet을 확인한다.
3. DaemonSet 레벨: “광고 주체가 살아있나?”
노드의 nvidia.com/gpu Allocatable은 Device Plugin DaemonSet이 kubelet에 GPU를 등록(advertise)해야 나타난다. Device Plugin은 ListAndWatch gRPC stream으로 GPU 개수를 kubelet에 지속 보고하고, kubelet이 이를 Allocatable에 반영하는 구조다(상세 동작은 NVIDIA Device Plugin 동작 원리 글 참고). Allocatable이 0이라면 1. Device Plugin DS 자체가 없거나, 2. DS는 있는데 plugin Pod가 GPU를 감지하지 못하거나 둘 중 하나다.
DS 존재 여부를 먼저 확인하고, 존재한다면 노드 내부(5단계)로 분기한다.
# gpu-operator 네임스페이스 DaemonSet 확인
kubectl get ds -n gpu-operator
NAME                                         DESIRED   CURRENT   READY   AGE
gpu-feature-discovery                        2         2         2       3h49m
gpu-operator-node-feature-discovery-worker   4         4         4       3h50m
nvidia-dcgm-exporter                         2         2         2       3h49m
nvidia-mig-manager                           0         0         0       3h49m
nvidia-operator-validator                    2         2         2       3h49m
nvidia-device-plugin-daemonset이 목록에서 사라졌다. 다른 DaemonSet 5개는 그대로인데, device-plugin DS만 없다.
# device-plugin Pod 직접 확인
kubectl get pods -n gpu-operator -l app=nvidia-device-plugin-daemonset
No resources found in gpu-operator namespace.
Pod도 없다. 그런데 이게 DS selector의 노드 라벨이 바뀌었기 때문인지, 아니면 DS 자체가 삭제된 것인지 구분해야 한다.
# DS의 nodeSelector로 쓰이는 라벨 확인
kubectl get nodes -L nvidia.com/gpu.deploy.device-plugin,nvidia.com/gpu.present
NAME                                               GPU.DEPLOY.DEVICE-PLUGIN   GPU.PRESENT
ip-192-168-xx-xx.ap-northeast-2.compute.internal
ip-192-168-yy-yy.ap-northeast-2.compute.internal
ip-192-168-aa-aa.ap-northeast-2.compute.internal   true                       true
ip-192-168-bb-bb.ap-northeast-2.compute.internal   true                       true
NFD 라벨 nvidia.com/gpu.deploy.device-plugin=true는 GPU 노드에 살아있다. nodeSelector 측 문제가 아니라 DS 자체가 사라진 것이다.
다음 분기: “DS 자체가 없다” → DS를 관리하는 Operator/ClusterPolicy를 확인한다.
4. ClusterPolicy / Operator 레벨: “누가 DS를 죽였나?”
Device Plugin DaemonSet은 GPU Operator 컨트롤러가 ClusterPolicy CR을 reconcile하면서 생성·삭제하는 리소스다. DS가 통째로 사라졌다면 1. ClusterPolicy spec에서 해당 컴포넌트가 비활성화되었거나, 2. Operator 컨트롤러 자체가 장애 상태여서 reconcile을 수행하지 못하는 두 가지 경우가 가능하다.
ClusterPolicy spec과 Operator 상태를 함께 확인한다.
# ClusterPolicy의 devicePlugin 설정값 확인
kubectl get clusterpolicy cluster-policy \
  -o jsonpath='{.spec.devicePlugin}' | jq .
{
    "enabled": false,
    "image": "k8s-device-plugin",
    "imagePullPolicy": "IfNotPresent",
    "repository": "nvcr.io/nvidia",
    "version": "v0.19.0"
}
enabled: false — 스모킹 건이다. 이 값 때문에 Operator가 device-plugin DS를 삭제한 것이다.
원인은 찾았지만, 실무에서는 “그럼 ClusterPolicy 전체 상태는 정상인가?”를 추가로 확인하게 된다. status.state를 확인해 보자.
# ClusterPolicy status 확인 — 함정 주의
kubectl get clusterpolicy cluster-policy -o jsonpath='{.status.state}'
ready
함정: status.state가 ready다. “의도적으로 disable한 것도 정상적인 reconcile 결과”이므로 Operator 입장에서는 ready가 맞다. status만 보고 안심하면 장애를 놓친다.
# Operator 컨트롤러 로그에서 devicePlugin 관련 메시지 확인
kubectl logs -n gpu-operator deploy/gpu-operator --tail=120 \
  | grep -i "device-plugin\|deviceplugin"
Operator 로그 발췌
{"level":"info","ts":1776590638.9078515,"logger":"controllers.ClusterPolicy","msg":"Number of nodes with GPU label","NodeCount":2}
{"level":"info","ts":1776590639.476854,"logger":"controllers.ClusterPolicy","msg":"ClusterPolicy step completed","state:":"state-device-plugin","status":"disabled"}
{"level":"info","ts":1776590639.5161002,"logger":"controllers.ClusterPolicy","msg":"ClusterPolicy step completed","state:":"state-mps-control-daemon","status":"disabled"}
"state-device-plugin","status":"disabled" — Operator가 device-plugin을 의도적으로 disabled 처리한 기록이다.
5. 노드 내부: “드라이버 vs 플러그인 분리 검증”
원인은 4에서 확정됐지만, 실무에서는 “드라이버 자체가 죽은 건 아닌지” 확인해야 할 때가 있다. driver 사망 vs plugin off는 외부 관찰만으로 구분이 어렵기 때문이다.
kubelet device-plugin 소켓 디렉토리
# GPU 노드에서 device-plugin 소켓 파일 확인
kubectl debug node/ip-192-168-aa-aa.ap-northeast-2.compute.internal \
  -it --image=public.ecr.aws/amazonlinux/amazonlinux:2023 \
  -- chroot /host ls -la /var/lib/kubelet/device-plugins/
total 20
drwxr-xr-x.  2 root root    61 ...
drwxr-xr-x. 10 root root 16384 ...
srwxr-xr-x.  1 root root     0 ... kubelet.sock
-rw-------.  1 root root   660 ... kubelet_internal_checkpoint
kubelet.sock과 kubelet_internal_checkpoint만 남아있다. nvidia-gpu.sock이 없다 — device-plugin이 kubelet에서 gRPC unregister한 흔적이다. 이 소켓은 Device Plugin이 시작할 때 생성하여 kubelet과의 gRPC 통신 채널로 사용하는 Unix domain socket이다(상세 동작은 NVIDIA Device Plugin 동작 원리 — 보고 참고). 소켓이 없다는 건 kubelet이 GPU 리소스를 광고할 수단 자체가 사라진 것이다.
chroot nvidia-smi의 함정
소켓이 없다면 혹시 드라이버 자체가 죽은 건 아닌지 의심할 수 있다. 노드에 직접 SSH하지 않고 확인하는 가장 빠른 방법이 kubectl debug node + chroot다.
# GPU 노드에서 chroot로 nvidia-smi 실행
kubectl debug node/ip-192-168-aa-aa.ap-northeast-2.compute.internal \
  -it --image=public.ecr.aws/amazonlinux/amazonlinux:2023 \
  -- chroot /host nvidia-smi -L
Failed to initialize NVML: Unknown Error
이 에러만 보면 드라이버가 죽은 것처럼 보이지만, 실제로는 드라이버가 정상이다. kubectl debug node는 호스트 PID/network namespace는 공유하지만, device namespace는 공유하지 않는다. nvidia-smi는 NVML 라이브러리를 통해 /dev/nvidia* device file에 접근해야 동작하는데, debug Pod의 /dev에는 GPU device file이 존재하지 않는다. chroot로 호스트 파일시스템의 바이너리를 실행해도 /dev는 여전히 debug Pod의 것이므로 NVML 초기화가 실패하는 것이다. 드라이버는 호스트 커널에 정상 로드되어 있다.
driver alive 검증 — dcgm-exporter Pod 활용
드라이버 생존 여부는 GPU device file이 올바르게 마운트된 Pod 안에서 확인해야 한다.
# dcgm-exporter Pod에서 nvidia-smi 실행 (device mount가 정상인 Pod)
DCGM_POD=$(kubectl get pods -n gpu-operator \
  -l app=nvidia-dcgm-exporter -o jsonpath='{.items[0].metadata.name}')
kubectl exec -n gpu-operator $DCGM_POD -- nvidia-smi -L
GPU 0: NVIDIA A10G (UUID: GPU-xxxxxxxx-xxxx-xxxx-xxxx-xxxxxxxxxxxx)
NVIDIA A10G가 정상 인식된다. 드라이버/toolkit은 살아있고, kubelet 광고만 끊긴 상태임이 확정되었다.
해결
ClusterPolicy 복구
# Device Plugin 재활성화
kubectl patch clusterpolicy cluster-policy --type=merge \
  -p '{"spec":{"devicePlugin":{"enabled":true}}}'
clusterpolicy.nvidia.com/cluster-policy patched
회복 관찰
복구 패치 직후 10초 간격으로 polling한다.
# 회복 polling (10초 간격)
for i in $(seq 1 12); do
  sleep 10
  ds=$(kubectl get ds -n gpu-operator nvidia-device-plugin-daemonset --no-headers 2>&1 \
    | awk '{print $2"/"$3"/"$4}')
  alloc=$(kubectl get node ip-192-168-aa-aa.ap-northeast-2.compute.internal \
    -o jsonpath='{.status.allocatable.nvidia\.com/gpu}' 2>&1)
  podstatus=$(kubectl get pod gpu-probe -o jsonpath='{.status.phase}' 2>&1)
  echo "T+$((i*10))s DS=${ds} Alloc='${alloc}' Pod=${podstatus}"
done
| 시점 | DS Ready | Allocatable GPU | gpu-probe |
|---|---|---|---|
| T+10s | 2/2/1 | 1 | Succeeded |
| T+20s | 2/2/1 | 1 | Succeeded |
| T+30s | 2/2/1 | 1 | Succeeded |
| T+40s | 2/2/2 | 1 | Succeeded |
- T+10초: DS가 재생성되고 1개 노드에서 Ready. Allocatable이 1로 복구되자마자 scheduler가 gpu-probe를 즉시 배치해 Succeeded로 전이
- T+40초: 양쪽 노드 모두 device-plugin Pod Ready. 완전 복구
gpu-probe가 이렇게 빨리 완료된 이유는 1. scheduler가 Pending Pod를 주기적으로 재시도하고, 2. CUDA 이미지가 이미 노드에 캐시되어 있으며, 3. nvidia-smi 명령 자체가 1초 미만에 끝나기 때문이다.
최종 검증
nvidia-smi 정상 확인
kubectl logs gpu-probe
GPU 0: NVIDIA A10G (UUID: GPU-xxxxxxxx-xxxx-xxxx-xxxx-xxxxxxxxxxxx)
name, driver_version, memory.total [MiB]
NVIDIA A10G, 580.126.09, 23028 MiB
Baseline과 100% 동일하다.
Events 시계열 — 장애와 복구가 한 객체에 보존
kubectl describe pod gpu-probe | tail -15
Events:
  Type     Reason            Age                    From               Message
  ----     ------            ----                   ----               -------
  Warning  FailedScheduling  6m9s (x3 over 9m40s)   default-scheduler  0/4 nodes are available:
                                                                       4 Insufficient nvidia.com/gpu.
  Normal   Scheduled         3m52s                  default-scheduler  Successfully assigned
                                                                       default/gpu-probe to
                                                                       ip-192-168-aa-aa...
  Normal   Pulled            3m52s                  kubelet            Container image already
                                                                       present on machine
  Normal   Created           3m52s                  kubelet            Container created
  Normal   Started           3m52s                  kubelet            Container started
FailedScheduling x3 over 9m40s → Scheduled 전이가 단일 Pod의 Events 안에 고스란히 남아있다. 장애 발생 시점부터 복구까지의 전체 타임라인을 하나의 Pod에서 추적할 수 있다.
DaemonSet AGE — 재생성 증거
kubectl get ds -n gpu-operator
NAME                                         DESIRED   CURRENT   READY   AGE
gpu-feature-discovery                        2         2         2       3h56m
gpu-operator-node-feature-discovery-worker   4         4         4       3h56m
nvidia-dcgm-exporter                         2         2         2       3h56m
nvidia-device-plugin-daemonset               2         2         2       3m55s    # ← 재생성됨
nvidia-mig-manager                           0         0         0       3h56m
nvidia-operator-validator                    2         2         2       3h56m
다른 DaemonSet은 AGE가 3시간 56분인데, nvidia-device-plugin-daemonset만 3분 55초다. disable 시 Operator가 DS를 통째로 삭제하고, enable 시 새로 생성했다는 증거다.
실무 운영 주의 사항
이번 실습에서는 ClusterPolicy를 수동 패치해 장애를 재현했다. 하지만 실무에서는 다양한 경로로 동일한 증상(GPU Pod Pending, Insufficient nvidia.com/gpu)이 발생한다. 각 시나리오가 위 디버깅 경로의 어느 단계에서 갈라지는지 매핑한다. (참고: EKS 디버깅 마스터 가이드)
DS 자체가 사라지는 경우
이번 실습과 동일한 패턴이다. 디버깅 경로 3(DaemonSet)에서 DS 부재를 발견하고, 4(ClusterPolicy/Operator)로 진행한다.
| 시나리오 | 원인 | 신호 |
|---|---|---|
| GPU Operator Helm upgrade 중 ClusterPolicy 리셋 | Helm values 변경 시 ClusterPolicy가 일시 재생성되면서 DS 삭제-재생성 윈도우 발생 | DS AGE가 비정상적으로 짧음 |
| 의도치 않은 ClusterPolicy 수정 | GitOps drift, 운영자의 kubectl patch 실수 |
spec.devicePlugin.enabled: false (이번 실습과 동일) |
| Operator 컨트롤러 장애 | gpu-operator Deployment가 OOMKill/CrashLoop이면 reconcile이 중단되고 DS 재생성 불가 | kubectl get deploy -n gpu-operator gpu-operator → 0/1 Ready |
DS는 Running인데 GPU 광고가 0인 경우
가장 혼란스러운 패턴이다. kubectl get ds에서 device-plugin이 정상처럼 보이는데 GPU가 0이다. 디버깅 경로 3에서 DS Running을 확인한 뒤 5(노드 내부)로 분기한다.
| 시나리오 | 원인 | 신호 |
|---|---|---|
| 드라이버 초기화 실패 | nouveau 모듈 충돌, AMI 드라이버와 GPU 하드웨어 불일치(예: K80에 550+ 드라이버) | device-plugin 로그에 No devices found. Waiting indefinitely |
FAIL_ON_INIT_ERROR=false 함정 |
기본값이 false라서 초기화 에러가 은폐됨. Pod는 Running이지만 GPU를 0개 광고 |
Pod STATUS는 Running인데 Allocatable GPU 0 |
| kubelet 재시작 후 소켓 재등록 실패 | systemctl restart kubelet 시 device-plugin이 GPU를 unhealthy로 마킹 |
kubelet restart 직후 갑자기 Allocatable 0, device-plugin Pod 재시작 없음 |
| config-manager 레이스 컨디션 | device-plugin v0.18.2+에서 Karpenter가 노드 라벨을 늦게 적용하면 빈 설정으로 초기화 | 신규 노드에서만 Allocatable 0, 기존 노드 정상 |
이 패턴에서는 device-plugin Pod의 로그가 핵심 단서다.
kubectl logs -n gpu-operator <device-plugin-pod>에서No devices found,Incompatible strategy,NVML error등의 메시지를 확인한다.
Pod spec 자체의 문제
디버깅 경로 1(Pod Events)에서 바로 발견할 수 있다.
| 시나리오 | 원인 | Events 메시지 |
|---|---|---|
| tolerations 누락 | GPU 노드 taint nvidia.com/gpu:NoSchedule에 toleration이 없음 |
had untolerated taint {nvidia.com/gpu} |
| resource limits 미지정 | nvidia.com/gpu limits 없이 배포 |
스케줄러가 GPU 노드를 고려하지 않음(GPU 관련 메시지 없음) |
디버깅 분기 플로우
위 시나리오들을 포함한 전체 디버깅 분기를 정리하면 다음과 같다. (참고: EKS 디버깅 마스터 가이드)
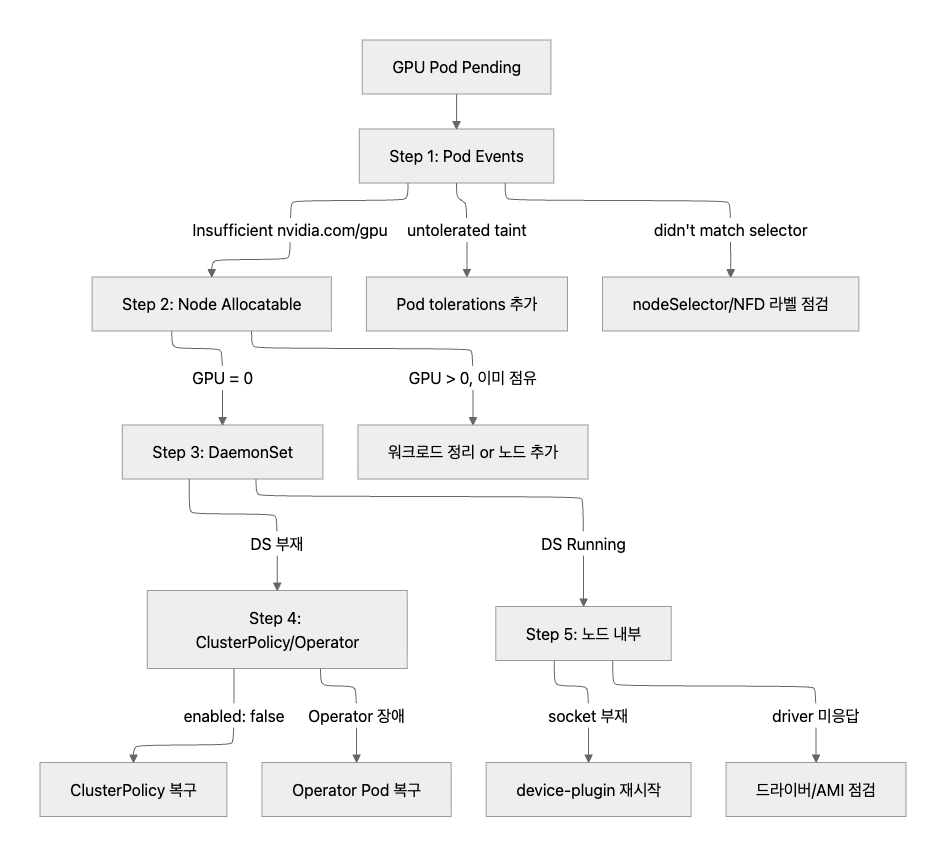
이번 실습에서 따라간 경로는 1 → 2 → 3(DS 부재) → 4(enabled: false) 루트다.
재발 방지
Prometheus alert — Allocatable 0 on GPU 노드
# GPU 노드인데 Allocatable GPU가 0인 상태를 감지
- alert: GpuAllocatableZeroOnGpuNode
  expr: |
    kube_node_status_allocatable{resource="nvidia_com_gpu"} == 0
    and on(node)
    kube_node_labels{label_nvidia_com_gpu_present="true"} == 1
  for: 2m
  labels:
    severity: page
  annotations:
    summary: "GPU node  advertises nvidia.com/gpu = 0"
    runbook: "Check ClusterPolicy spec.devicePlugin.enabled and gpu-operator logs"
== 0조건: 키 잔존 + 값 0 패턴을 잡는다 (absent()만으로는 누락)on(node) gpu.present=true조인: 시스템 노드의 false alarm 차단for: 2m: Operator restart 등 일시적 reconcile 윈도우 흡수
GitOps로 ClusterPolicy 잠금
- ClusterPolicy CR을 Git에 보관 → ArgoCD/Flux로 sync. drift 감지 시 자동 복원
- RBAC로 운영자의
clusterpolicies.nvidia.comUPDATE 권한 제거 (관리자만 유지) - 이중 차단(GitOps + RBAC)으로 사람의 kubectl patch 경로를 원천 차단
DS Ready 등치 검증
status.state 함정을 우회하는 추가 alert다. Device Plugin DS의 Ready 수가 GPU 노드 수와 일치하는지 직접 검증한다.
# DS Ready 수 ≠ desired 수 감지
- alert: DevicePluginDaemonSetNotFullyReady
  expr: |
    kube_daemonset_status_number_ready{daemonset="nvidia-device-plugin-daemonset"}
    !=
    kube_daemonset_status_desired_number_scheduled{daemonset="nvidia-device-plugin-daemonset"}
  for: 5m
정리
요약
| 항목 | 장애 상태 | 복구 상태 |
|---|---|---|
ClusterPolicy spec.devicePlugin.enabled |
false | true |
| Device Plugin DS | 삭제됨(NotFound) | 2/2/2 Ready (AGE 재시작) |
Node Allocatable nvidia.com/gpu |
0(키 잔존) | 1 |
| gpu-probe Pod | Pending(FailedScheduling x3) | Succeeded (A10G / 580.126.09 / 23028 MiB) |
ClusterPolicy status.state |
ready(함정) | ready |
| Reconcile 시간 | <10초 | <40초 |
운영 함정 3가지
ClusterPolicy spec.devicePlugin.enabled 한 줄을 끄면 Operator reconcile이 10초 안에 device-plugin DaemonSet을 통째로 삭제하고, 노드의 Allocatable nvidia.com/gpu는 키가 잔존한 채 값만 0으로 떨어진다. 이 시나리오에서 주의할 운영 함정을 정리한다.
1. status.state: ready 함정
ClusterPolicy의 status.state가 ready를 유지한다. “의도적 disable도 정상 reconcile 결과”이기 때문이다. status만 모니터링하면 의도적 disable과 사고를 구분할 수 없다.
2. kubectl debug node ... chroot nvidia-smi 함정
chroot 환경에서 nvidia-smi를 실행하면 Failed to initialize NVML: Unknown Error가 뜬다. GPU device file 마운트 한계 때문이지 driver 사망이 아니다. driver alive 검증은 dcgm-exporter 등 device mount가 정상인 Pod 안에서 해야 한다.
3. Allocatable 키 잔존 함정
Allocatable에서 nvidia.com/gpu 키가 사라지지 않고 값만 0으로 남는다. Prometheus의 absent() 기반 alert rule은 이 패턴을 놓친다. == 0 조건을 사용해야 한다.
다음 단계
이번 글에서는 인프라 층(Device Plugin 비활성화)에서 GPU Pod Pending을 재현했다. 다음 글에서는 같은 GPU 환경 위에서 어플리케이션 계층 장애를 재현한다. vLLM 서빙 엔진의 기동 실패 시나리오(KV cache 부족, context window 초과, TP 불일치)를 다룬다.

댓글남기기